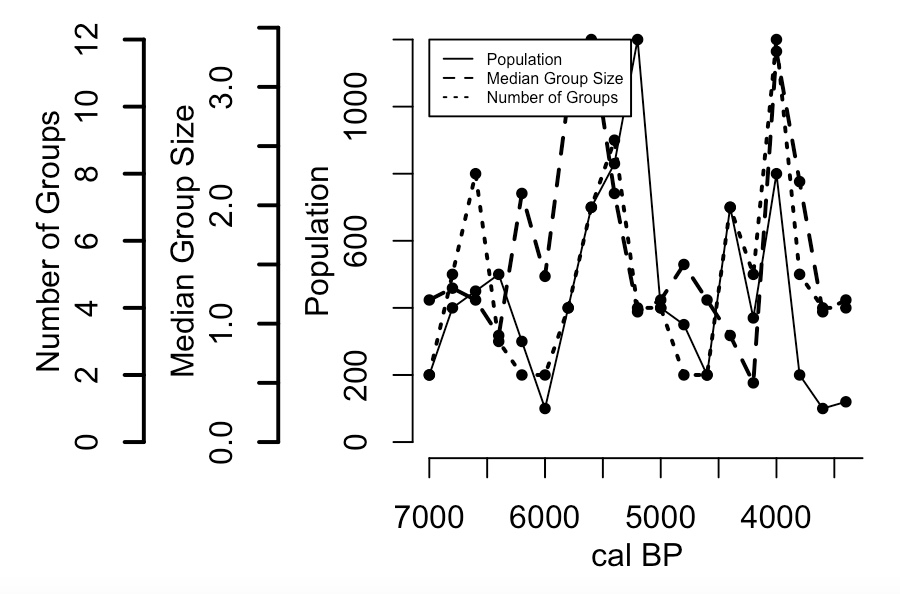
time<-seq(7000, 3400, -200)
pop<-c(200, 400, 450, 500, 300, 100, 400, 700, 830, 1200, 400, 350, 200, 700, 370, 800, 200, 100, 120)
grp<-c(2, 5, 8, 3, 2, 2, 4, 7, 9, 4, 4, 2, 2, 7, 5, 12, 5, 4, 4)
med<-c(1.2, 1.3, 1.2, 0.9, 2.1, 1.4, 2.9, 3.4, 2.1, 1.1, 1.2, 1.5, 1.2, 0.9, 0.5, 3.3, 2.2, 1.1, 1.2)
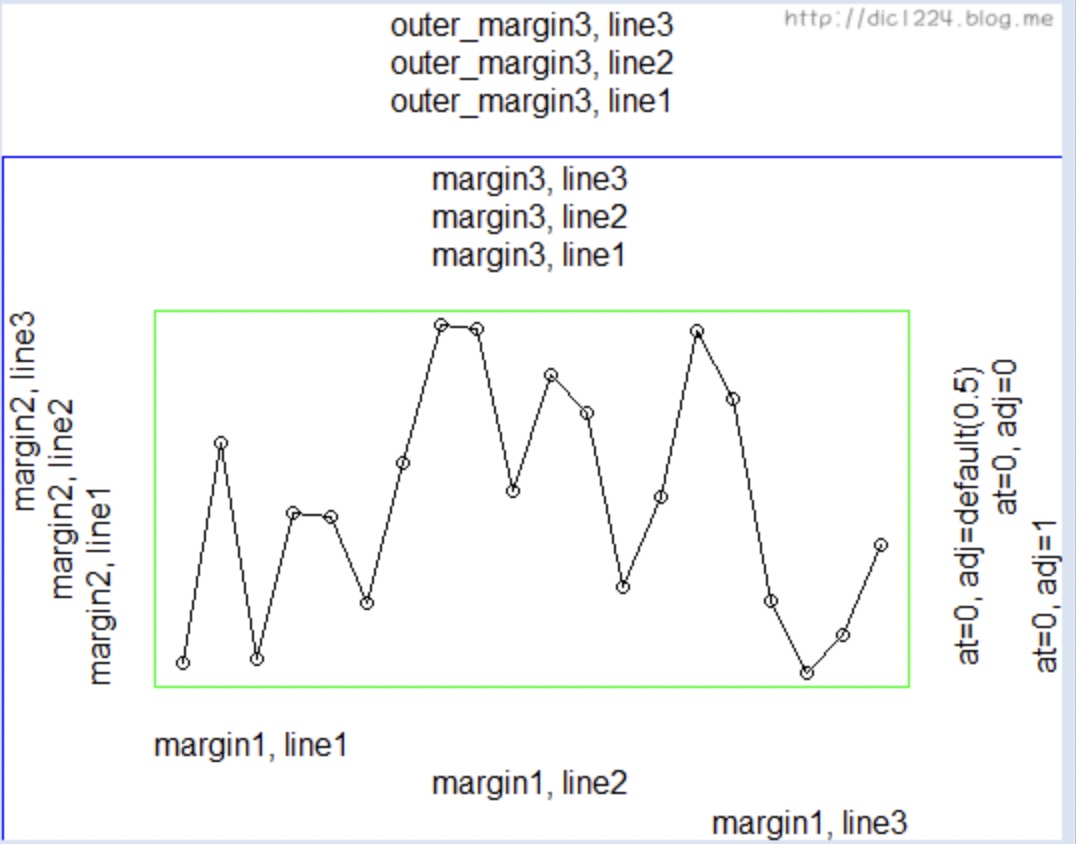
par(mar=c(5, 12, 4, 4)+0.1)
par()에서 mar은 파라미터를 설정하는 인수이다.
default로 c(5, 4, 3, 2)+0.1이다.
c( 아래쪽, 왼쪽, 위쪽, 오른쪽 ) margin을 의미
plot(time, pop, axes=F, ylim=c(0, max(pop)), xlab="", ylab="", type="l", col="black", main="", xlim=c(7000, 3400)) # 선
points(time, pop, pch=20, col="black") # 점
axis(2, ylim=c(0, max(pop), col="black", lwd=2)) # y axis
mtext(2, text="Population", line=2) # y axis 축 이름(line은 상대적 위치)
par(new=T) # 두 번째 그래프
plot(time, med, axes=F, ylim=c(0, max(med)), xlab="", ylab="", type="l", lty=2, main="", xlim=c(7000, 3400), lwd=2)
points(time, med, pch=20)
axis(2, ylim=c(0, max(med)), lwd=2, line=3.5)
mtext(2, text="Median Group Size", line=5.5)
par(new=T) # 세 번째 그래프
plot(time, grp, axes=F, ylim=c(0, max(grp)), xlab="", ylab="", type="l", lty=3, main="", xlim=c(7000, 3400), lwd=2)
points(time, grp, pch=20)
axis(2, ylim=c(0, max(grp)), lwd=2, line=7)
mtext(2, text="Number of Groups", line=9)
axis(1, pretty(range(time), 10)) # x축(range 간격을 10개로 분할)
mtext("cal BP", side=1, col="black", line=2)
legend(x=7000, y=12, legend=c("Population", "Median Group Size", "Number of Groups"), lty=c(1, 2, 3), cex=0.5)

Pretty BreakPoints
base::pretty(x, n=5)x: an object of coercible to numeric
n: integer giving the desired number of intervals.
mtext

line position
